Analyse, group & pivot data on list pages in D365 Business Central using multiple tabs

Continuing our D365 Release Wave 1 Plans for 2023 Series, we are delighted to share an exciting feature update, which now includes a new Analysis mode on list pages, this allows you to check data directly in Business Central and save views, without the need to open in Excel and run a report.
Check out the easy steps below to learn How to Analyse, group & pivot data on list pages in D365 BC using multiple tabs (as shared by – Taking the Web out of the box with Microsoft Dynamics 365 Business Central, Stefano Demiliani, Microsoft MVP)).
Dynamics 365 Business Central 2023 Wave (v22) release introduces a new Analyse view mode in list pages directly on browser. End users and data analysts can analyse data from list pages directly in the client without the need to open the page in Excel or run a report.
Analysis mode is a new way of interacting with data on list pages. Instead of running reports using different options and filters, you can simply add multiple tabs that represent different tasks or views on the data. When you’re ready to analyse data on a list page (where you might have filtered data using a view or filter pane), simply switch to analysis mode:

How does Analysis Mode work in D365 Business Central?
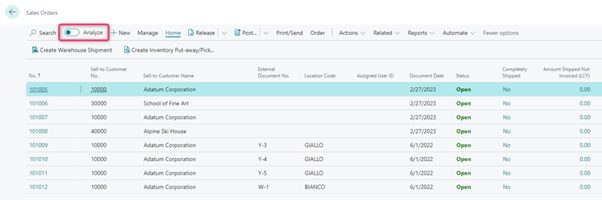
Analyse, group & pivot data on list pages in D365 BC using multiple tabs – Let’s imagine that we want to analyse your expected sales volume and so we want to see sales orders details with the sales amount for orders not yet shipped broken down to customer and year/month.
To do that, open the Sales Orders list page and switch on Analyse:
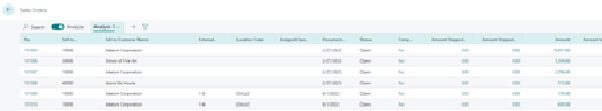
Analysis mode opens the data in a new experience that’s optimised for data analysis. When a page is in analysis mode, it’s split into two areas:
- The main data area (including a Tabs pane): use the data area to interact with the data. For columns that are summable, you can easily get descriptive statistics on a set of fields by marking them.
- The field modifier area: use the field modifier area to control the data to show and its format. On the menu, you choose the fields to show or hide.
When the page is on Analysis View mode, go to the Columns menu and remove all columns (click the box next to the Search field):
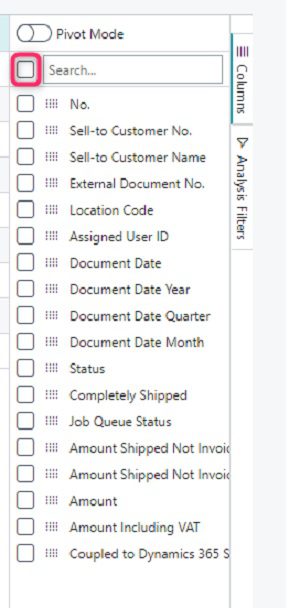
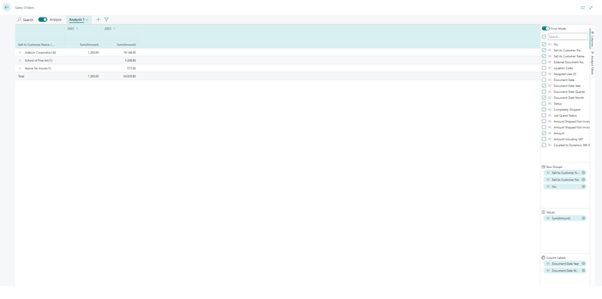
Analyse, group & pivot data on list pages in D365 BC using multiple tabs – Turn on Pivot mode (located directly above the Search field). Now, drag the fields Sell-to Customer Name, Sell-to Customer No., and No. fields to the Row Groups area (in that order). Then drag the field Amount to the Values area. Finally, find the Document Date Year and Document Date Month fields and drag them to the Column Labels area (in that order).
You will have something like the following:
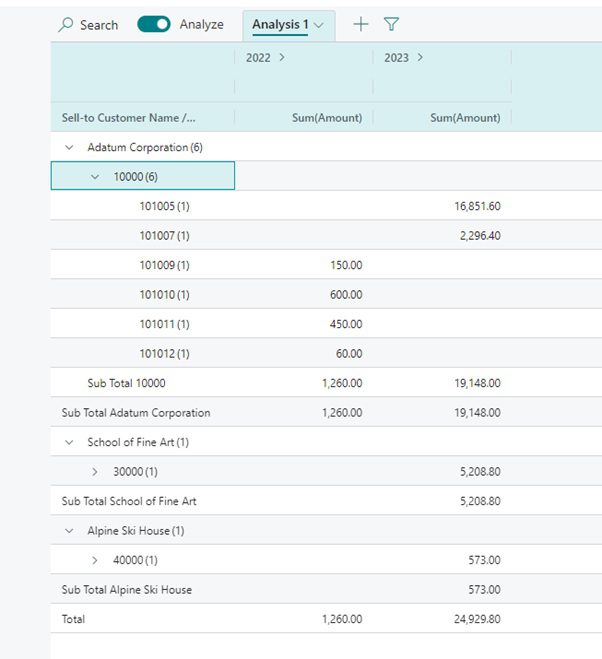
Now you can drill down on your data and do your analysis entirely in the browser:
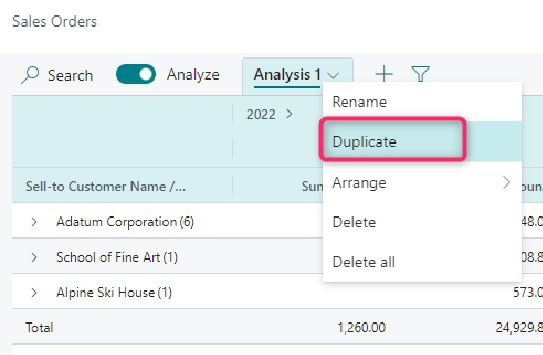
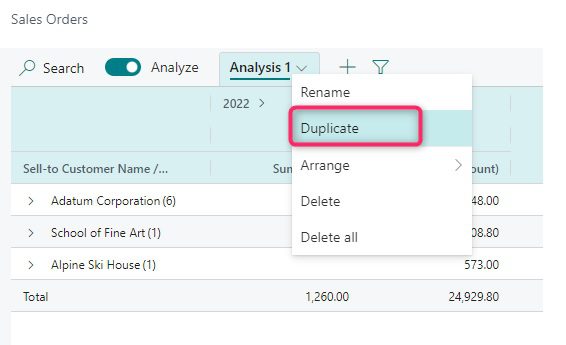
You can also duplicate the analysis to do other analysis starting from the previously created one:
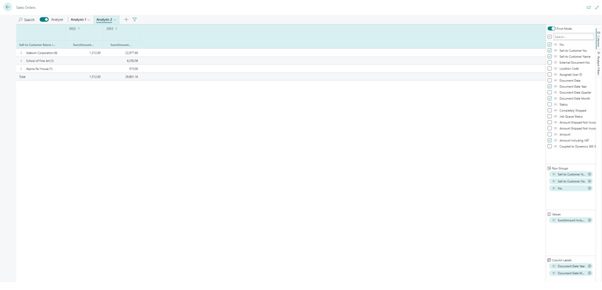
In this second analysis for example, the sample shows the Amount Including VAT field:
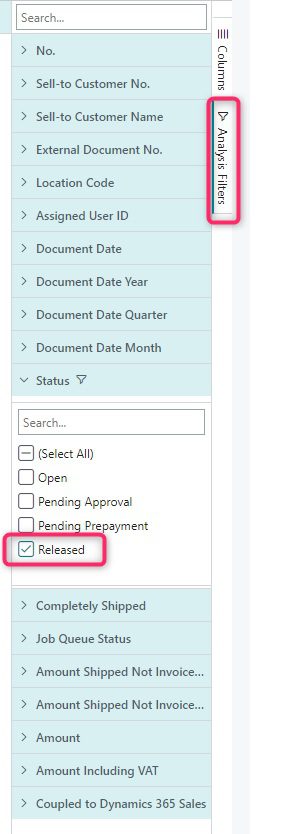
By clicking on the Analysis Filters tab, you can change and apply filters:
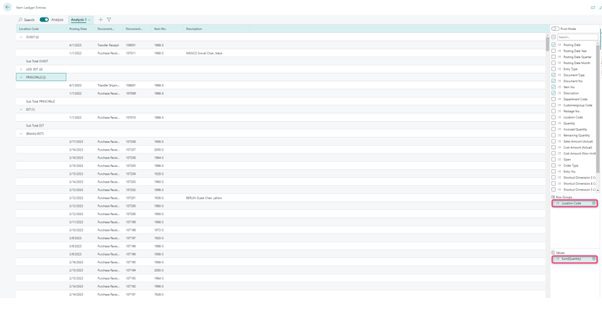
You can quickly do all the analysis you want without exporting data now. Just to give some other examples, here is an analysis showing how items move between locations:
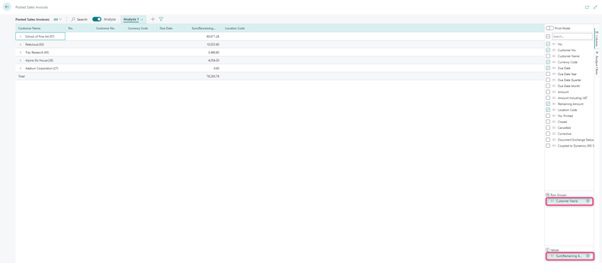
Here an analysis showing the remaining amount to invoice for customers:
These samples makes it really clear how these new feature works. However, Please remember that going to analysis mode will load all data into your browser and at the time of writing this post, there’s a limit on the number of rows returned to the browser (currently above 100,000 rows). Applying the right filters is important here…
How to enable Analyse, group & pivot data on list pages in D365 BC using multiple tabs feature?
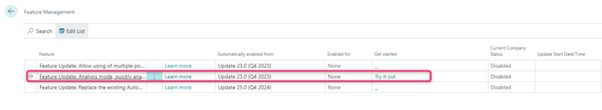
The new Analyse group & pivot data on list pages in D365 BC using multiple tabs feature is in public preview, which means your administrator must turn it on before you can try it. To enable it, simply go to the Feature Management page and enable Analysis mode:
You might also be interested in some of the other exciting features in D365 Business Central Wave 1 2023:
- How to Manage user permissions using security groups in D365 Business Central
- How to Set up and sync master data across companies in Dynamics 365 Business Central.
- Microsoft Dynamics 365 Release Wave 1 2023 Update
Why Microsoft Dynamics 365 Business Central is a global leader in ERP?
Microsoft Dynamics 365 Business Central is a business management application for small and mid-sized organisations that automates and streamlines business processes. Highly adaptable and feature rich. Business Central enables companies to manage their finances, supply chain, manufacturing, operations, project management, sales, marketing services, and more.
Companies can easily customise and add functionality to meet all business and industry needs. Business Central is fast to implement, easy to configure, and simplicity guides innovations in product design, development, implementation, and usability and offers flexible and competitive pricing options.
If you are looking to enhance your end to end business operations, have any questions? need assistance? or want to hear how we are helping our Customer Success Stories with Microsoft Dynamics 365 solutions – please contact our D365 Team, we are here to help!
| Book Your Free Dynamics 365 Consultation Here | or, Contact Us |

